 im1.jpg | 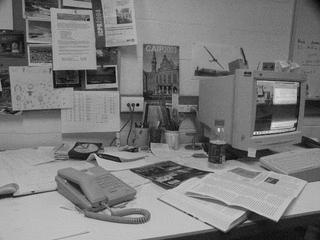 im2.jpg |
im1.jpg | im2.jpg |
% Parameters
nonmaxrad = 3; % Non-maximal suppression radius
dmax = 50; % Maximum search distance for matching
w = 11; % Window size for correlation matching
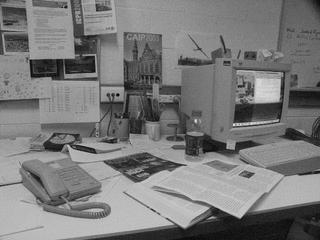
im1 = imread('im1.jpg');
im2 = imread('im2.jpg');
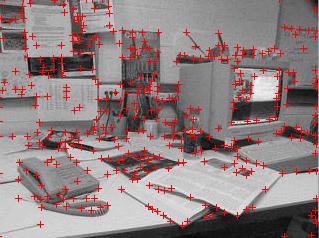
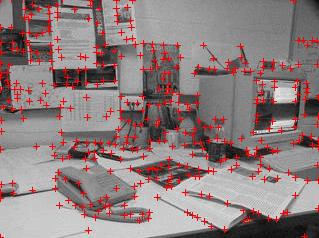
% Find 100 strongest Harris corners in image1 and image2
[cim1, r1, c1] = harris(im1, 1, 0.04, 'N', 100, 'radius', nonmaxrad);
show(im1,1), hold on, plot(c1,r1,'r+');
[cim2, r2, c2] = harris(im2, 1, 0.04, 'N', 100, 'radius', nonmaxrad);
show(im2,2), hold on, plot(c2,r2,'r+');
| 
|
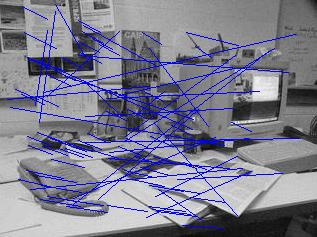
    [m1,m2] = matchbycorrelation(im1, [r1';c1'], im2, [r2';c2'], w, dmax);

    % Display putative matches
    show(im1,3), set(3,'name','Putative matches'), hold on
    for n = 1:length(m1);
	line([m1(2,n) m2(2,n)], [m1(1,n) m2(1,n)])
    end
% Assemble homogeneous feature coordinates for fitting of the
% fundamental matrix, note that [x,y] corresponds to [col, row]
x1 = [m1(2,:); m1(1,:); ones(1,length(m1))];
x2 = [m2(2,:); m2(1,:); ones(1,length(m1))];
t = .001; % Distance threshold for deciding outliers
[F, inliers] = ransacfitfundmatrix(x1, x2, t);
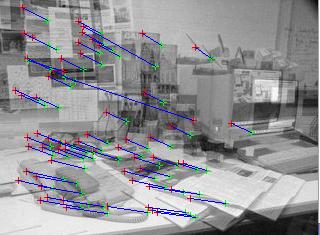
% Display both images overlayed with inlying matched feature points
show(double(im1)+double(im2),4), set(4,'name','Inlying matches'), hold on
plot(m1(2,inliers),m1(1,inliers),'r+');
plot(m2(2,inliers),m2(1,inliers),'g+');
for n = inliers
line([m1(2,n) m2(2,n)], [m1(1,n) m2(1,n)],'color',[0 0 1])
end
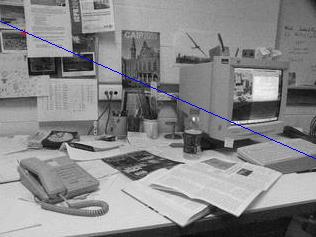
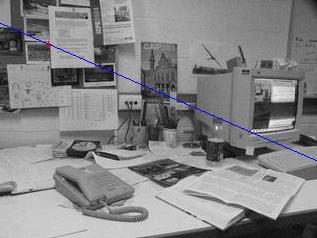
    % Step through each matched pair of points and display the
    % corresponding epipolar lines on the two images.

    l2 = F*x1;    % Epipolar lines in image2
    l1 = F'*x2;   % Epipolar lines in image1

    for n = inliers
	figure(1), clf, show(im1,1), hold on, plot(x1(1,n),x1(2,n),'r+');
	hline(l1(:,n));
	figure(2), clf, show(im2,2), hold on, plot(x2(1,n),x2(2,n),'r+');
	hline(l2(:,n));
	fprintf('hit any key to see next point\r'); pause
    end
| 
|
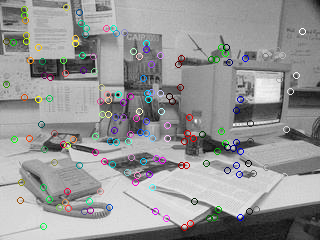
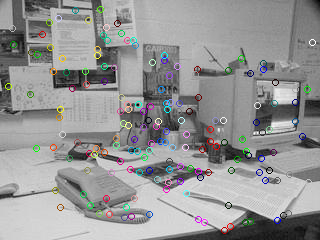
Here's another way to visualize the matches suggested by José L. Crespo which works rather nicely. It displays each image with the putative matches marked as circles with different colors. Using the colorcube map produces different colors for nearby points allowing them to be distinguished from each other.
   col=colormap(colorcube(size(m2,2)));
   figure(1), imshow(im1,[]), hold on
   scatter(m1(2,:),m1(1,:),[],col);
   hold off

   figure(2), imshow(im2,[]), hold on
   scatter(m2(2,:),m2(1,:),[],col);
   hold off
| 
|